International trade drives the global economy and is responsible for around 80 % of global goods transport by sea. Access to the two most important canals, the Panama and Suez Canals, is fundamental for uninterrupted supply chains and therefore also for economic growth. Current disruptions show the vulnerability of these important shipping routes.
Suez Canal
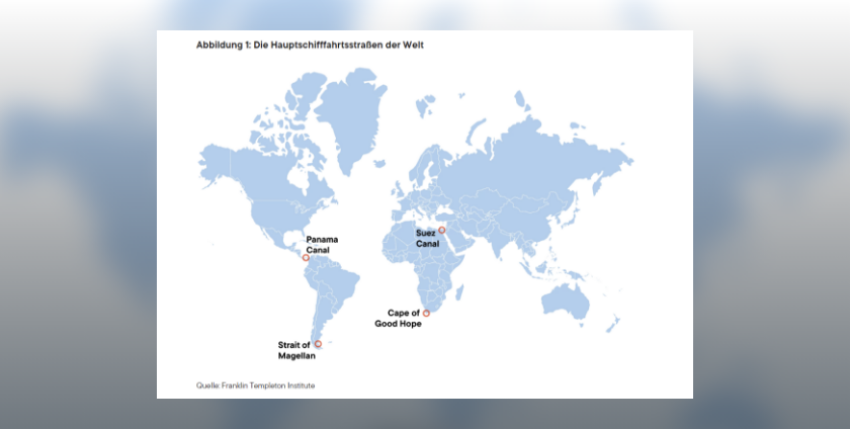
The French Compagnie Universelle du Canal Maritime de Suez completed this shipping route in 1869. It connects the Mediterranean with the Red Sea and became the fastest and most economical route between Europe and Asia. Around 30 % of global container traffic, i.e. up to 15 % of global trade, passes through this waterway, generating a turnover of almost 9 billion euros per year.
The route from Singapore to Rotterdam via the Suez Canal is around 8,500 nautical miles (approx. 15,750 kilometres) long and takes 26 days. The diversions via the Cape of Good Hope around the southern tip of Africa extends the journey to 11,800 miles (approx. 21,850 km) and 36 days. This incurs additional fuel costs of almost 1 million euros for the outward and return journey.
Due to the missile and drone attacks by the Iranian-backed Houthi militias, shipping traffic was reduced by around 42% in December 2023 and January 2024. Although the US-led Operation Prosperity Guardian and Operation EUNAVFOR Aspides were able to minimise their attacks, they have not yet been able to stop them.
Freight rates have skyrocketed accordingly and have risen by over % since December 2023 for the route from Shanghai to Europe, for example, and insurance premiums have also risen sharply.
We got another taste of disrupted supply chains in March 2021, when the channel was blocked for six days by the grounded container giant "Ever Given" (200,000 tonnes, 400 metres long) and hundreds of ships were jammed on both sides of the shipwreck. Lloyd's List estimates that container freight worth almost 9 billion euros was held up every day.
Currently, 9.2 million barrels of oil (around 1.5 million cubic metres) and 116 million m3 of liquefied natural gas are transported through the canal every day. These are relevant quantities that immediately impact supply chains and therefore prices in the event of a failure.
Panama Canal
The canal, which was completed by the USA in 1914, connects the Pacific with the Atlantic and compensates for a 26 metre difference in altitude using inland lakes and locks. Therefore, considerable amounts of water from the drinking water lakes are needed to lock a ship through the canal.

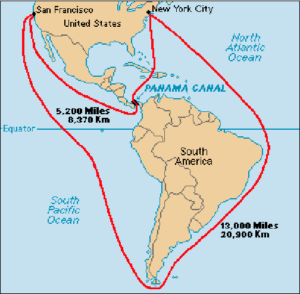
According to Research Gate, the distance between New York City and San Francisco via the Panama Canal is approximately 5,200 miles (about 8,370 km). However, if the Panama Canal has to be circumnavigated around Cape Horn (southern tip of South America), ships will cover a distance of approx. 13,000 miles (approx. 20,900 km). This reduction in distance through the Panama Canal by more than half saves a lot of time and fuel and is therefore the preferred route. The Panama Canal handles an estimated 5% of world trade.
Climate change is already causing significant problems for Panama and the current El Niño weather phenomenon is exacerbating the drought, with an immediate impact on the canal's capacity. Normally, around 14,000 ships pass through the canal every year, transporting 600 million tonnes of goods and generating a turnover of over 4.5 billion euros. Due to a lack of water in Lake Gatun, the usual 36 to 38 locks per day - after only 18 locks in February 2024 - are currently back to 27 ships (March 2024). The Panama Canal Authority attributes the reductions to higher temperatures in the Atlantic (El Niño) and the lack of rainfall, which was exacerbated by a delayed rainy season.
Movement of goods
The Suez Canal is mainly used to transport commercial goods, food and oil, while the Panama Canal is the route for over 20% of global soya bean exports and 15% of corn exports. It is also the main route for LNG exports to Asia.

Due to the lack of Russian gas deliveries, supply volumes were also diverted from the Middle East to Europe. This even led to more favourable prices in the European Union.
However, there are also indications that European importers are building up stocks again instead of having to stop production with just-in-time delivery.
Another immediate problem for US soya exporters is the Mississippi River, which is also experiencing lower water levels due to the drought and therefore more frequent restrictions on shipping. Almost 60 % of US grain exports (wheat, soya beans, corn) are transported via this route by barge to the export terminals in the Gulf of Mexico.
Alternatives
And who benefits from this? Possibly producers in Brazil who ship their soya beans to China via the Atlantic route around the Cape of Good Hope.
US farmers in the Midwest, on the other hand, can use the existing railway lines to the US West Coast or to the Mexican Pacific ports.
Consequences
It is not yet possible to estimate whether these two bottlenecks will lead to drastic and noticeable restrictions in supply chains with rising prices.
It also depends, among other things, on how the relationship between supply and demand develops in the respective target markets and the extent to which longer sea routes affect the reduced availability of transport space.
It would therefore be sensible to keep an eye on these developments.
Sources: Franklin Templeton, Research Gate


